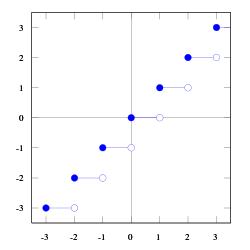
קובץ:Floor function.svg
קפיצה לניווט
קפיצה לחיפוש

גודל התצוגה המקדימה הזאת מסוג PNG של קובץ ה־SVG הזה: 600 × 600 פיקסלים. רזולוציות אחרות: 240 × 240 פיקסלים | 480 × 480 פיקסלים | 768 × 768 פיקסלים | 1,024 × 1,024 פיקסלים | 2,048 × 2,048 פיקסלים | 1,000 × 1,000 פיקסלים.
לקובץ המקורי (קובץ SVG, הגודל המקורי: 1,000 × 1,000 פיקסלים, גודל הקובץ: 16 ק"ב)
תקציר
| תיאור | |
| תאריך יצירה | 30 במרץ 2006 (תאריך העלאה מקורי) |
| מקור | נוצר על־ידי מעלה היצירה |
| יוצר | לא סופק יוצר ששמו ניתן לקריאה במכונה. בהתבסס על תביעות זכויות יוצרים, ההנחה היא כי Omegatron (שיחה · תרומות) הוא היוצר. |
| גרסאות אחרות |
|
| SVGהתפתחות |


רישיון
Created by User:Omegatron using gnuplot, possibly with post-processing in the GIMP (PNG) or Inkscape (SVG)
אני, בעל זכויות היוצרים על היצירה הזאת, מפרסם אותה בזאת תחת הרישיונות הבאים:
הקובץ הזה מתפרסם לפי תנאי רישיונות קריאייטיב קומונז ייחוס-שיתוף זהה 3.0 לא מותאם, 2.5 כללי, 2.0 כללי ו־1.0 כללי.
- יש לך חופש:
- לשתף – להעתיק, להפיץ ולהעביר את העבודה
- לערבב בין עבודות – להתאים את העבודה
- תחת התנאים הבאים:
- ייחוס – יש לתת ייחוס הולם, לתת קישור לרישיון, ולציין אם נעשו שינויים. אפשר לעשות את זה בכל צורה סבירה, אבל לא בשום צורה שמשתמע ממנה שמעניק הרישיון תומך בך או בשימוש שלך.
- שיתוף זהה – יצירת רמיקס, שינוי או בנייה על סמך החומר הזה, תטיל עליך חובה להפיץ את התרומות שלך לפי תנאי רישיון זהה או תואם למקור.

|
מוענקת בכך הרשות להעתיק, להפיץ או לשנות את המסמך הזה, לפי תנאי הרישיון לשימוש חופשי במסמכים של גנו, גרסה 1.2 או כל גרסה מאוחרת יותר שתפורסם על־ידי המוסד לתוכנה חופשית; ללא פרקים קבועים, ללא טקסט עטיפה קדמית וללא טקסט עטיפה אחורית. עותק של הרישיון כלול בפרק שכותרתו הרישיון לשימוש חופשי במסמכים של גנו. |
אפשר לבחור את הרישיון שמתאים לך.
(In short, this means that you can copy and modify the image freely as long as you provide attribution; preferably in the form of a link back to this page.)
Instructions
See Wikipedia graph-making tips.
 # Set square 1000×1000 SVG output and filename
 # The font size (fsize) sets the size for the circles, too.
 set terminal svg enhanced size 1000 1000 fname "Times" fsize 36
 set output "floor.svg"

 # Set the text value for missing entries in the data file, so we can plot a [[w:discontinuous function|discontinuous function]]
 set datafile missing "Skip"

 # Set y axis limits so the plot doesn't go right to the edges of the graph
 set yrange [-3.5:3.5]
 # Set x axis limits so the first and last points are hidden
 set xrange [-3.5:3.5]

 # No legend needed
 set nokey

 # Add lightly-colored axis lines
 set yzeroaxis
 set xzeroaxis

 # Plot as lines and also points (circles)
 plot "floor.dat" with lines
 plot "floor.dat" with points 1 6

 # Close the file (so I don't have to close gnuplot to view it)
 set output
and data file:
floor.dat
#  X     Y1
   -3    -4
   Skip
   -3    -3
   -2    -3
   Skip
   -2    -2
   -1    -2
   Skip
   -1    -1
   0     -1
   Skip
   0     0
   1     0
   Skip
   1     1
   2     1
   Skip
   2     2
   3     2
   Skip
   3     3
   4     3
Then I opened the resulting SVG file in Inkscape, changed the fill style for the circles (either blue or white fill), brought the plot lines to the top, and then brought the circles to the top (over the lines).
External links
היסטוריית הקובץ
ניתן ללחוץ על תאריך/שעה כדי לראות את הקובץ כפי שנראה באותו זמן.
| תאריך/שעה | תמונה ממוזערת | ממדים | משתמש | הערה | |
|---|---|---|---|---|---|
| נוכחית | 01:05, 22 במאי 2006 | | 1,000 × 1,000 (16 ק"ב) | wikimediacommons>Omegatron | i like blue better |
שימוש בקובץ
הדף הבא משתמש בקובץ הזה: